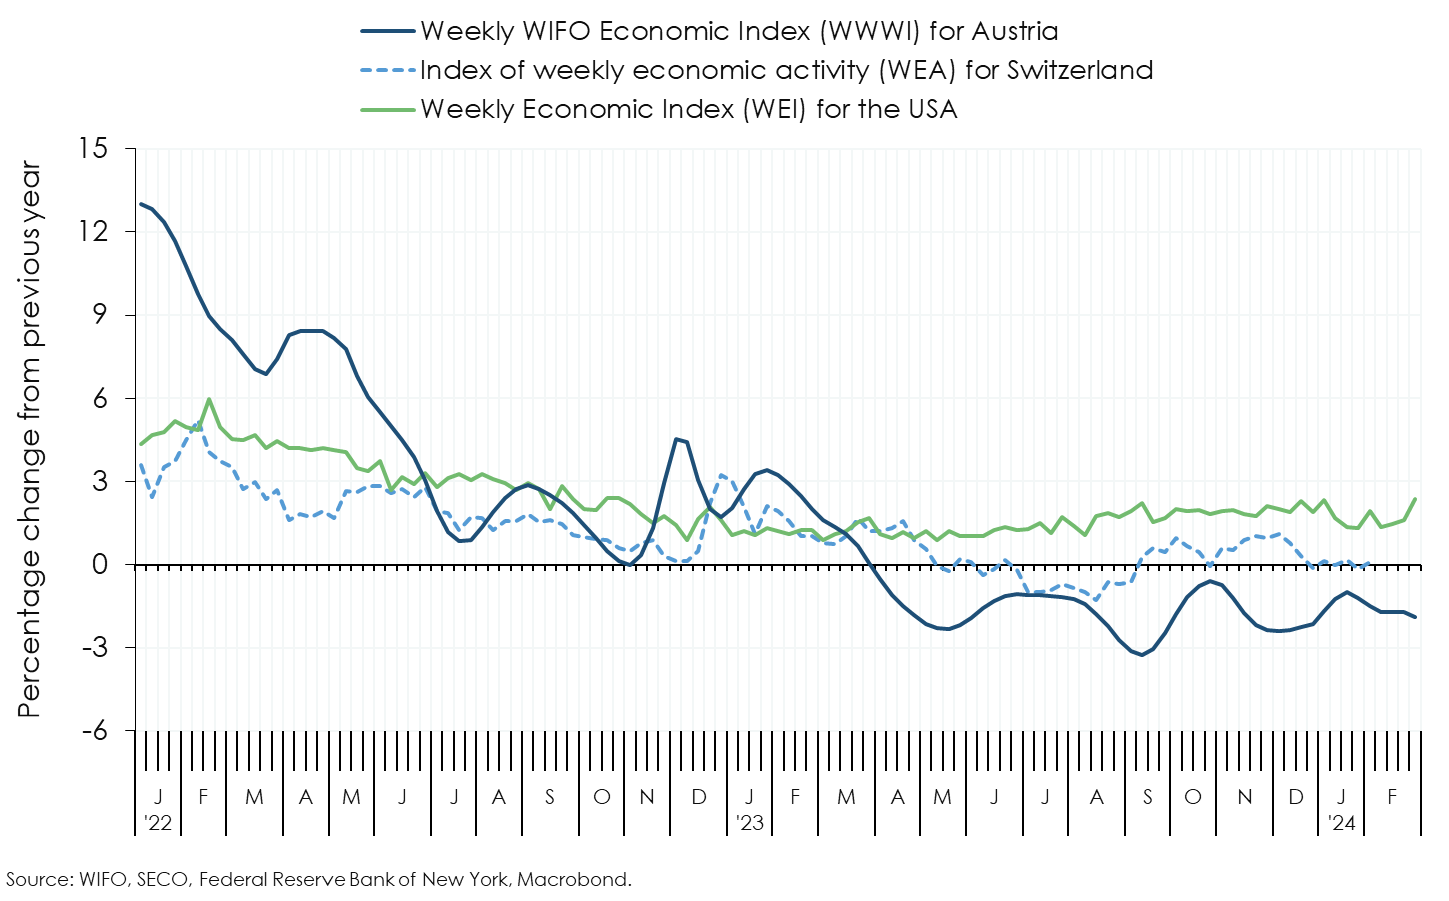

The Weekly WIFO Economic Index (WWWI) is a measure of the real economic activity of the Austrian economy on a weekly and monthly frequency. It is based on weekly, monthly and quarterly time series to estimate weekly and monthly indicators for real GDP and 18 GDP sub-aggregates (use side 8, production side 10) of the Quarterly National Accounts.
With the release for June 2022, the econometric models for the historical decompositions and for nowcasting have been converted to seasonally unadjusted time series. In addition, year-on-year growth rates are now used to estimate the models.
The WWWI estimates are (currently) updated monthly and published on WIFO's website.
Economic activity based on the weekly GDP indicator (WWWI) decreased by 1 percent compared to the previous year in March (calendar weeks 10 and 13).
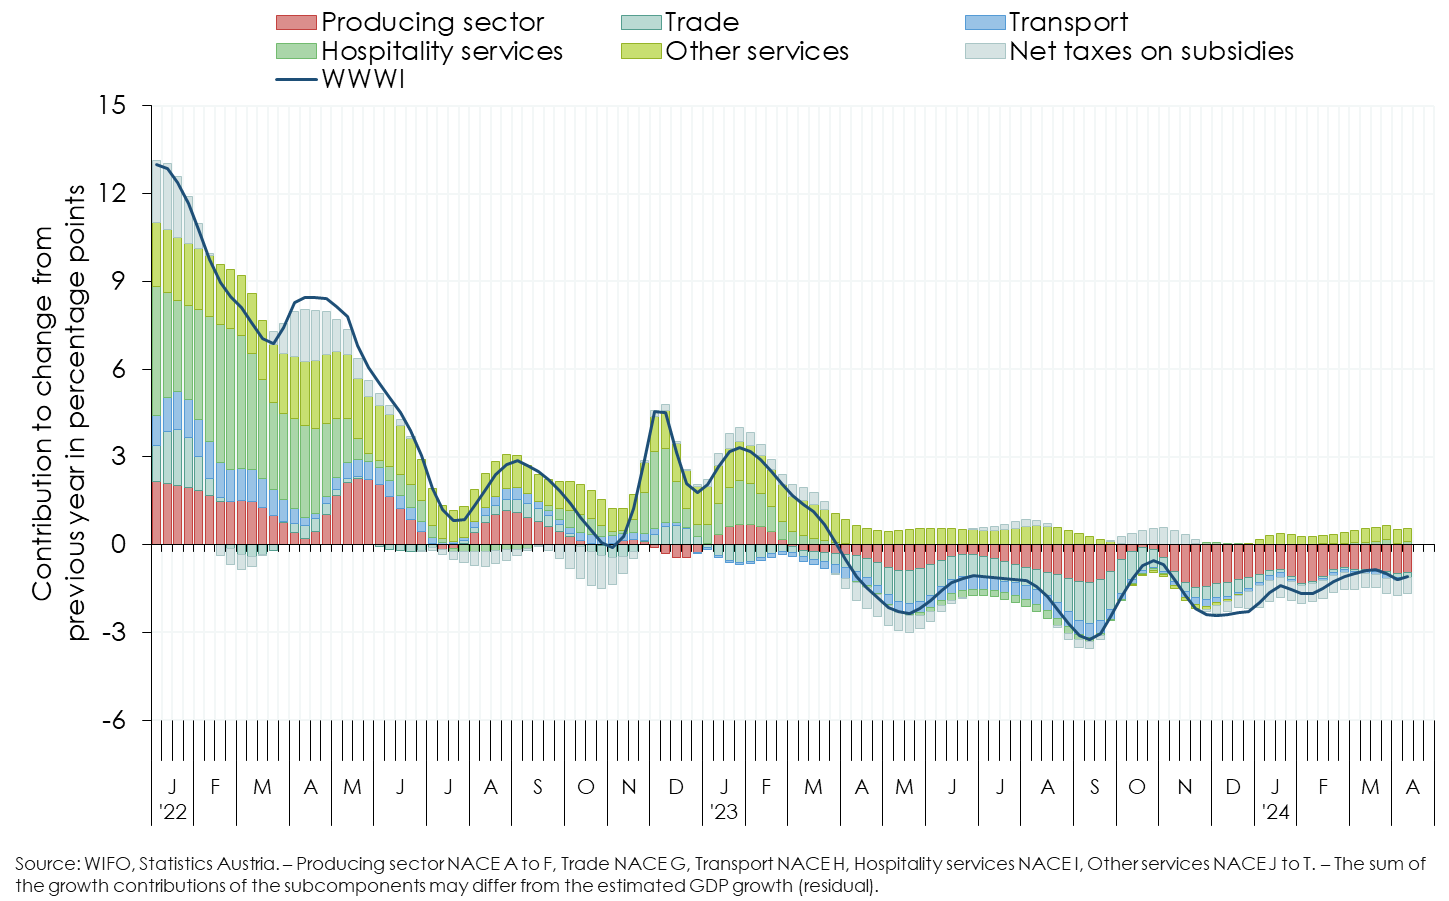
Based on the weekly real GDP indicator (WWWI), domestic output in March (calendar weeks 10 to 13; 4 to 31 March) and in the first half of April (calendar weeks 14 and 15, 1 to 14 April) was 1 percent lower than in the same period of the previous year (February –1½ percent, revised)1. The current calculations for the months February to April are influenced by seasonal effects that cannot be corrected by using the year-on-year changes in the model estimates2. In February, the economy is affected by an extra working day (leap day on 29 February), but the impact on output is likely to be small given the recession in industry and construction. In 2024, Holy Week and Easter fell in the last week of March (calendar week 13) – in 2023, Easter fell in the first week of April (calendar week 14) –, which gave a positive boost to tourism and trade on the output side and to retail trade and private consumption on the demand side in March. For calendar week 14 2024, this in turn leads to a weaker economic performance compared to the same week of the previous year.
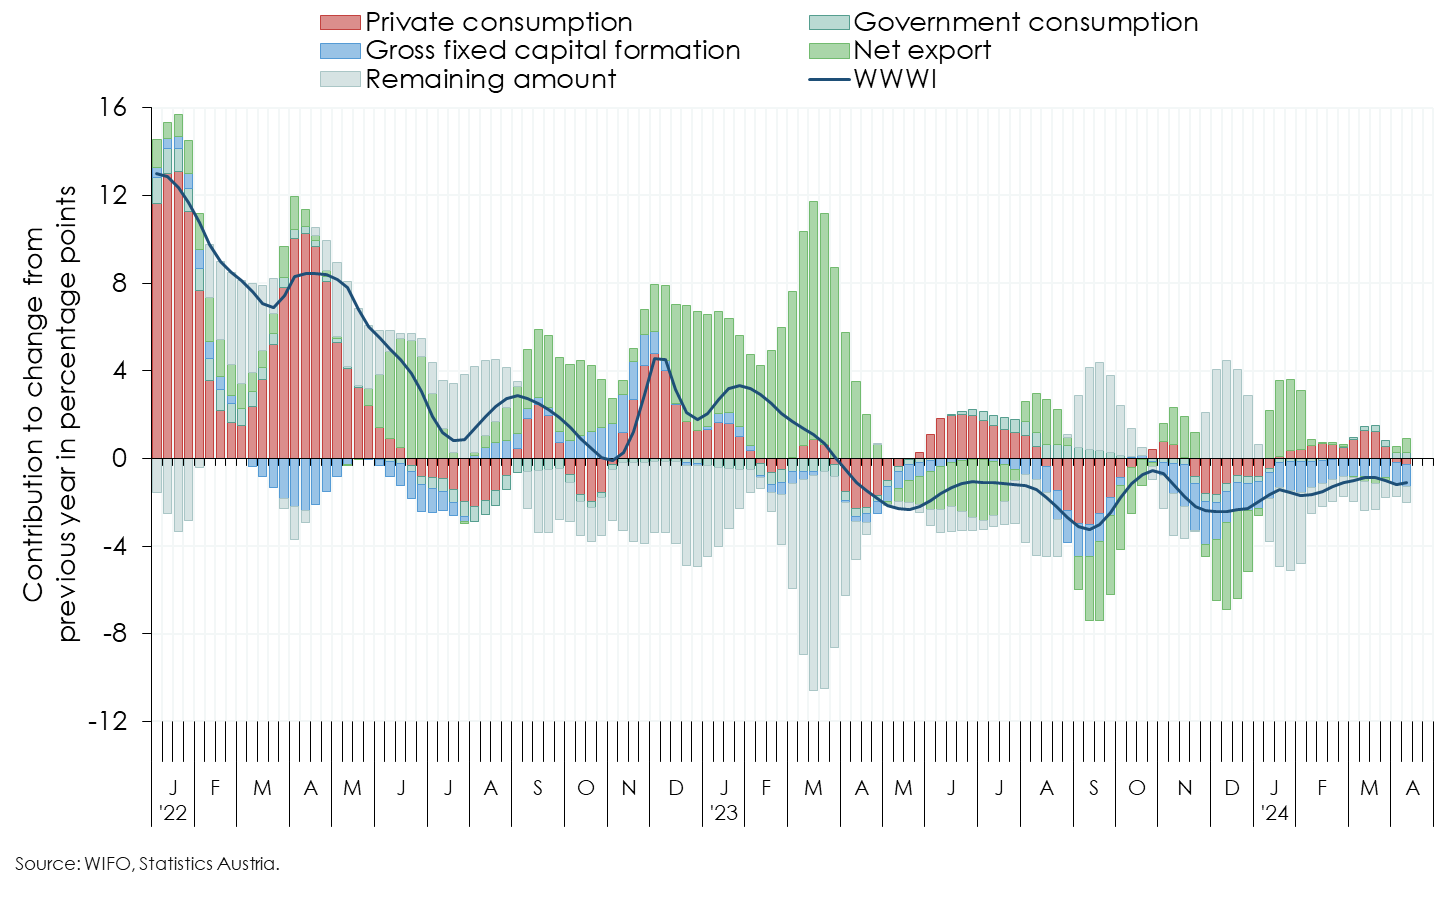
The inflation-adjusted volume of non-cash transactions, as an indicator of household consumption, shows a marked increase in demand for goods (retail sales) in March and a slight decline in the first half of April compared with a year earlier. Demand for services follows the same pattern, albeit slightly more pronounced. Private consumption is estimated to have been just under 2 percent above last year's level in March and ½ percent below in early April. The higher momentum in March compared to February (+1 percent) is likely to be mainly due to the Easter effect. Estimates of turnover based on cashless payments for retail trade and tourism services show a significant increase during the Easter week and (as expected) a marked decrease in calendar week 14.
The development of gross fixed capital formation is determined by economic output (industrial production) and sentiment in the manufacturing sector (according to the WIFO-Konjunkturtest, business cycle survey). In March the decline is estimated at 3¾ percent year-on-year (February –4¾ percent).
The number of trucks on Austria's motorways and the volume of rail freight traffic fell again in March compared to the same period last year. In contrast, the number of flights handled at Vienna Airport continued to rise. Overall, exports fell slightly more than imports, resulting in a slight decline in the net export balance. The estimated growth contribution of net exports in the broad sense to GDP was therefore slightly negative at –¼ percentage point in March (February +½ percentage point).
The weakness of freight transport is also reflected in the value added of the transport sector (NACE 2008, section H). At –2¼ percent in March and –1 percent in the first half of April, it remained below the level of a year ago (February –1¼ percent).
Employment in the goods-producing sector (NACE 2008, sections A to E) continued to fall in March as a result of the recession, and the number of people looking for work has been rising at double-digit rates year-on-year since November 2023. Although the WIFO-Konjunkturtest (business cycle survey) shows a slight improvement in the assessment of the situation, the pessimistic sentiment still prevails in the manufacturing sector. WIFO expects value added in the goods producing sector to have been 3 percent lower in March and 3½ percent lower in the first half of April than in the previous year.
Sentiment among construction companies also remains below average. The rise in the number of people registered as unemployed in the construction sector, which has now lasted for more than a year, remained high in March and April, despite very favourable weather conditions, and employment continued to fall (for a good six months). Value added in construction (NACE 2008, section F) is expected to have fallen by 3¼ percent year-on-year in March and by 3 percent in the first half of April (February –3 percent).
Easter effects can also be seen in tourism and (to a lesser extent) in trade in March. Based on cashless transactions in hotels and restaurants, sentiment indicators from the WIFO-Konjunkturtest (business cycle survey) and online searches by foreign guests, value added in tourism (accommodation and food services, NACE 2008, section I) is estimated to have been 2¼ percent higher in March and 1½ percent higher in early April than in the same period of the previous year (February +½ percent). In the distributive trades (NACE 2008, section G), value added was ¾ percent down in March and 1½ percent down at the beginning of April (February –¾ percent).
The ongoing unfavourable development in the manufacturing sector continues to dampen the momentum in remaining market services (NACE 2008, sections J to N), as the current employment situation and the sentiment indicators of the WIFO-Konjunkturtest (business cycle survey) also show. Year-on-year, value added stagnated in March and contracted by ¼ percent in the first half of April (February –½ percent). For other personal services (NACE 2008, sections R to T), the January estimate was revised significantly upwards (+8¾ percent, +7 percentage points) on the basis of advance sales tax figures (raw data). Based on this improved starting position and the price-adjusted non-cash payments in the events sector, year-on-year growth in value added is estimated to have been 4 percent in March and 3½ percent in the first half of April (February +5½ percent).
1 The inclusion of newly published monthly and quarterly data, which have to be met when estimating the WWWI, has led to a revision of the WWWI for GDP: January –¼ percentage point, February +¼ percentage point. On the production side, noteworthy upward revisions occurred in the goods producing sector (NACE 2008, sections A to E), the other personal services (NACE 2008, sections R to U), the remaining market services (NACE 2008, sections J to N) and construction (NACE 2008, section F).
2 Adjustment procedures for the leap year effect in February and the calendar effect of Easter in March and April 2024 are not applicable due to the short sample period – weekly data are available from January 2019 to mid-April 2024.